In practice, bugs rarely show up as “the whole thing is wrong.” They usually
show up as something local. The simpler fallback was scattered print output.
That works, but it does not give me a stable way to move between stages — or to
keep one node in view across transformations.
A browser UI, perhaps with threepenny-gui, would have worked, but it felt like
too much machinery for a tool whose data is mostly structural. Right now, a
terminal is a better fit, and brick keeps the inspector in the same executable
and the same development loop. If more is needed, we can switch to something
else.
Presently, the demo executable supports a few modes:
stack exec -- metasonic-bridge

stack exec -- metasonic-bridge --inspect chain

stack exec -- metasonic-bridge --inspect-only fanout
You can run all graphs, or pass names such as chain or fanout. If you omit
targets, all available demo graphs run in sequence. In --inspect mode, the
inspector opens first. After you quit it, the executable prints a compilation
summary and then starts audio. In --inspect-only mode, it stops after
inspection. An explicit --audio-only flag is also accepted, though that is
just the default behavior spelled out.
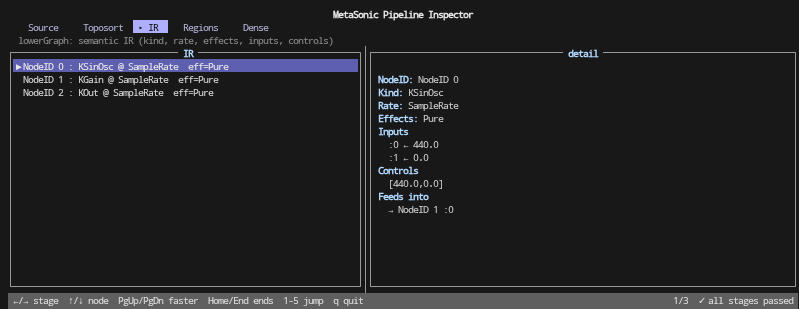
The current interface is dead-simple: a stage-specific list on the left and a detail view for the selected item on the right. Navigation is keyboard-only. That is enough to make the compiler inspectable without turning the inspector into a separate subsystem.
One choice was clear from the start: the UI should not be the thing that runs compiler passes. The inspector is built around a precomputed trace of the pipeline. The compiler runs first; the UI renders the results afterward. That keeps the interface simple and makes failures easier to reason about, because even a partial trace can still show how far the pipeline got before it stopped.
I chose to keep the inspector in the same executable as the audio demo instead of spinning it out into a separate tool. That keeps the inspector, the demo graphs, and the compiler version-locked. When the pipeline changes, the inspection path changes with it. No separate binary to drift.
The downside is that the executable carries the terminal UI stack — though compilation flags could strip it out. For now, that trade-off is worth it. The whole point of the inspector is to stay close to the code that produces the data. If we want to split that later, the task is not exactly “rocket science”.
The current inspector is static and stage-oriented, which is useful already. There are a few things I want next.
The first is diff-style presentation between stages. Seeing one stage is useful. Seeing exactly what changed between two stages would be better.
The second is tighter feedback during development. Recompiling and reopening manually is fine, but a watch mode would turn the inspector from a debugging convenience into an iteration loop.
The third is live graph replacement: sending a newly compiled graph to the
runtime without restarting the audio stream. That is not how the current system
works. Today, reloading is explicitly a stop, clear, rebuild, restart path: the
ABI exposes create, clear, add, set, connect, &c.; loadRuntimeGraph begins
with rt_graph_clear; and the runtime’s clear operation stops active audio.
A no-restart graph swap will require a new runtime/ABI handoff. I’m just going slow there since it touches the boundaries and will have more implications later.
As far as UI is concerned, I still want a separate runtime-facing UI on the C++ side. Dear Imgui is the tool I’m more comfortable with on this side, and it has very interesting features that will be useful there. The terminal inspector answers compiler questions. A runtime tool should answer execution questions. Those are related, but they are not the same problem.